In the course of 2018 and 2019, MultiMed Engineers carried out an internal research programme aimed to investigate the application of Data Analytics technologies to the capturing, analysis and interpretation of human behavior as a determinant of health.
In fact, while the study of the associations between behavior and disease has contributed to a large and invaluable body of knowledge to public health management, such associations have been generally investigated in a targeted way, with attention paid to a relatively small number of “known culprits”, typically: physical inactivity, unhealthy dietary habits, alcohol consumption and smoking[1].
On the other hand, it is increasingly acknowledged that the impact of human conduct on health risks is arbitrated through a more complex network of causes, effects, and “causes of the causes”[2], which – if disentangled – can lead to the discovery of as yet unknown behavioral factors involved in disease’ onset.
MultiMed Engineers envisions that new Data Analytics technologies, linked to the uptake of modern “smart environments[3]”, can be appropriately marshaled with the intent of “sequencing” the whole spectrum of human behavior, and agnostically associate it with health outcomes, giving a significant contribution to the advancement of epidemiology research. Such concept is envisaged in Figure 1.
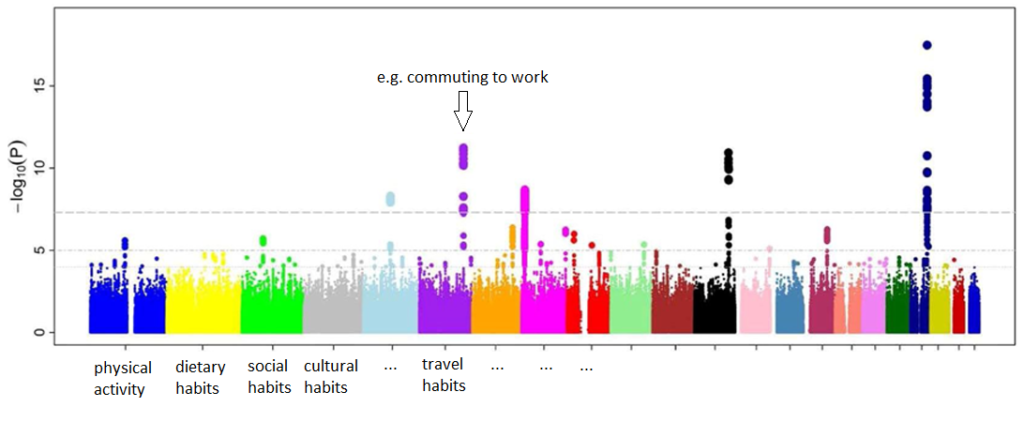
Figure 1. The behaviorome concept, imagined by MultiMed Engineers: “behavioral chromosomes” and “behavioral loci” will become available to conduct new types of exposure association studies
There are several advantages in capturing and analyzing a human behavior as a health factor:
- behavior is linked to and carry information on the health status of the person
- it allows to better leverage lower level data – that can be increasingly collected through IoT-based, smart devices – by lifting them to a higher semantic level, that is more easily understood by clinicians
- behavior itself is a determinant of health
- it is a modifiable determinant: in fact, behavior – both individual and social – might offer outstandingly effective “attack surfaces” for decision makers willing to mitigate health risks (a known fielded case is the UK Behavioural Insight Team – formerly the Nudge Unit – which the UK government put in place to inform policy and improve public services based on modelling and analyzing behaviors.)
Figure 2 represents the novel types of association studies that, in the view of MultiMed Engineers, can be unleashed by the development and measurement of the human behaviorome.
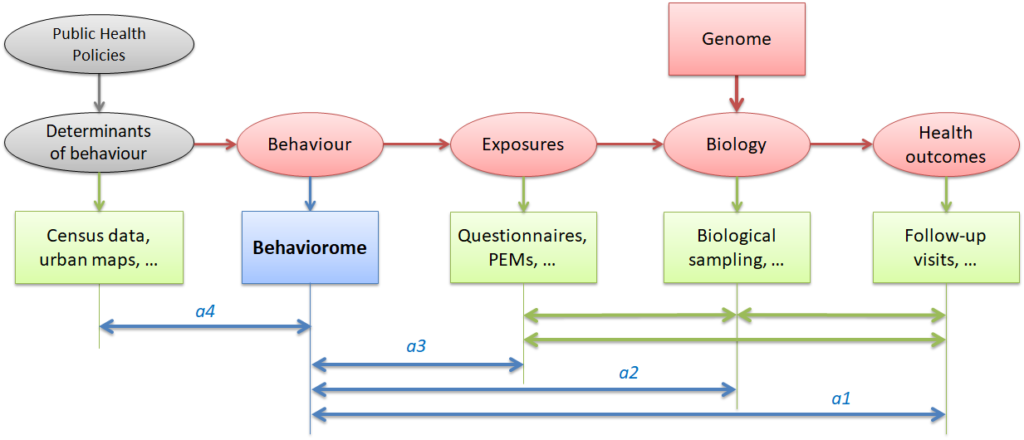
Figure 2. Introducing the behaviorome in epidemiology research (ovals: causative chain, boxes: measures)
To pursue this view, during 2018, MultiMed Engineers has conducted a thorough survey and study of the scientific literature, reviewing several tens of papers, in order to identify the state of the art and open research challenges. It has then conducted research activities aimed at solving such challenges. This work resulted in a first scheme for the characterization and measurement of the behaviorome, defined at two levels as illustrated in the following paragraphs.
- Design of the overall concept for behaviorome measurement (see Figure 3). Such concept allows to move away from the current “ad hoc” way to study how behavior influences health – which focuses of narrower, pre-defined objectives and risks missing associations which are important but difficult to postulate in advance – and moves towards a truly agnostic approach, that allows to conduct “behaviorome-wide” studies, that have the potential to discover any “signal” hidden in the data that can be collected and analyzed through the modern Data Analytics approaches.
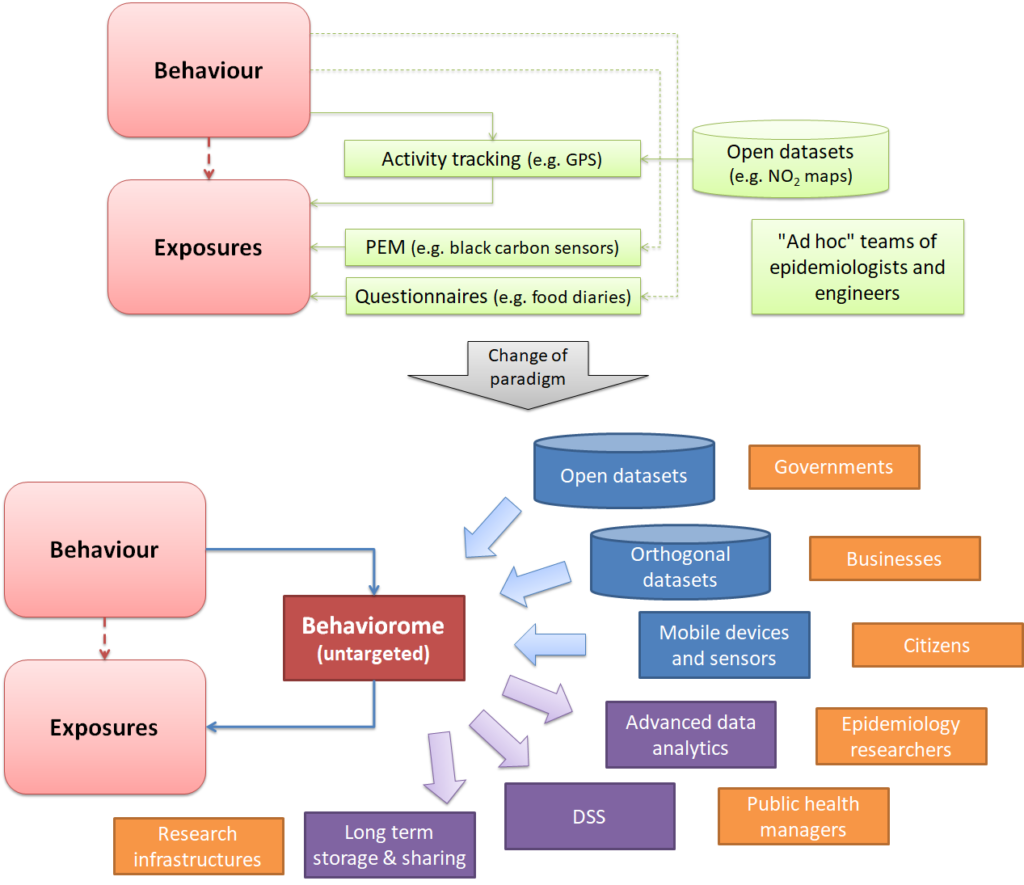
Figure 3. The behaviorome concept: moving behavioral exposure measurement from an “ad hoc”, targeted approach to a generic, fully agnostic one
- Design of an innovative technical architecture to measure the behaviorome (see figure 4). Such architecture implies the development and combination of innovative technology components, including ontological modelling of the behaviorome concept, continuous unobtrusive personal data collection, integration of orthogonal datasets, behavior recognition technologies, and data analysis, interpretation and visualization technologies.
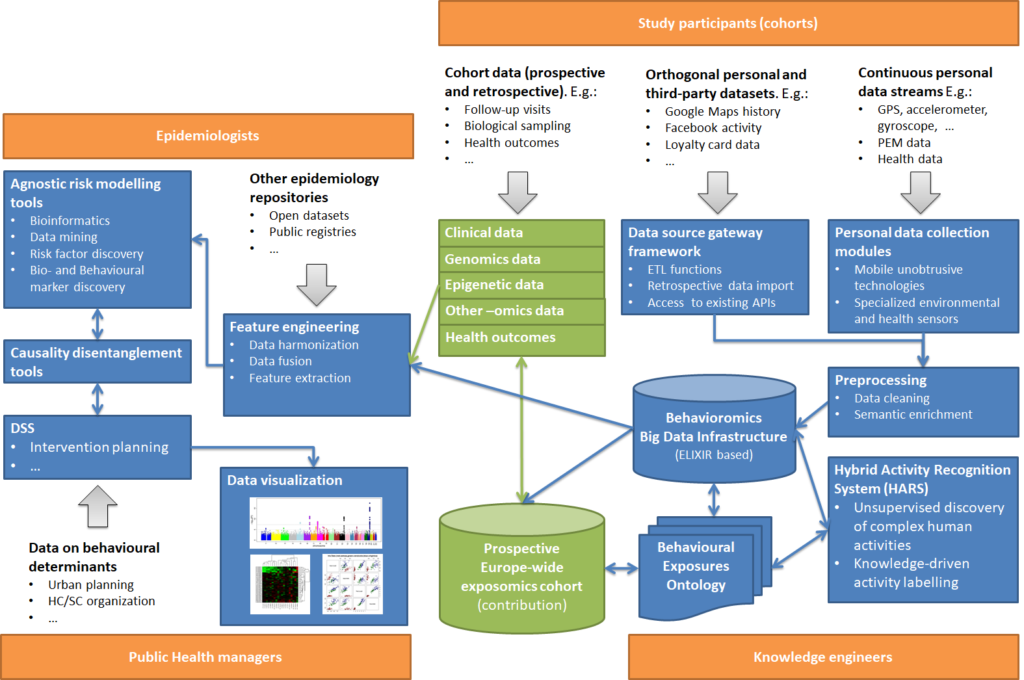
Figure 4. Behaviorome measurement architecture: toolbox components (blue), data (grey arrows), actors (orange) and other exposome resources (green)
The application of these results will make it possible to achieve significant advances in epidemiology research, as exemplified in Table 1, which compares the scheme developed by MultiMed Engineers with one of the reference efforts in the field, from De Nazelle et al.[4]
| Infrastructure | |
| De Nazelle et al. | · Smartphone retrofitted with large battery
· CalFit App for location tracking and energy expenditure estimation · Travel mode(s) to be recorder by subjects on a paper travel diary · Barcelona spatial-temporal maps of air pollution |
| Hypothetical behaviorome instance | · Conventional smartphones or smart-trackers
· Existing APIs (e.g. Google Maps API and Google Places API for location) · Open datasets of air pollution |
| Monitoring period | |
| De Nazelle et al. | · One week |
| Hypothetical behaviorome instance | · 24 months |
| Procedures | |
| De Nazelle et al. | · Data is downloaded from smartphones.
· Identifiable locations in travel diaries are manually geocoded and travel modes associated to them. · Data computed from spatial-temporal maps are integrated with inhalation rates computed on the basis of physical activity, measured through the smartphone accelerometer and gyroscope, to derive a precise assessment of NO2 exposure. |
| Hypothetical behaviorome instance | · Data is automatically stored, integrated and harmonized in a cloud repository, from where it is immediately available for usage within the system’s data analytics suite |
| Example features | |
| De Nazelle et al. | Locations: 4 types (home, work, in transit, other)
Recognized behaviors: AT_LOCATION: Being at a certain location with associated level of physical activity in METs |
| Hypothetical behaviorome instance | Locations: up to 126 types, recognized by Google Places API (e.g. airport, amusement_park, art_gallery, bank, bar, book_store, bowling_alley, bus_station, car_repair, city_hall, department_store, gas_station, gym, hospital, park, pharmacy, subway_station, etc.)
Recognized behaviors (examples): · SHOPPING: doing shopping with associated shop type (e.g. organic food, book shop, supermarket, etc.), city neighborhood and possibly list of bought items · AT_RESTAURANT: visiting a restaurant with associated type (e.g. generic, Italian, Thai, vegetarian, etc.) · BUS_RIDE: riding a bus, with associated start and stop locations · WALKING: walking stretch, with associated average speed · AT_DOCTOR: visiting a GP, with associated duration · HOUSEKEEPING: doing housekeeping chores at home, with associated duration and level of physical activities in METs |
| Possible discoveries of interest to epidemiologists | |
| De Nazelle et al. | · Association between NO2 exposure and disease |
| Hypothetical behaviorome instance | · Association among Instrumental Activities of Daily Living (e.g. shopping, communications, transportation, housekeeping, financial management, medication management, etc.) and disease
· Association among time spent in socialization activities and disease · Association among selected nutritional habits (e.g. visits to restaurants, bars and cafes, food buying habits, etc.) and disease · Association among usage of healthcare services and disease |
| Possible discoveries of interest to public health managers | |
| De Nazelle et al. | · Travel activities disproportionately contribute to inhaled NO2 with respect to other activities |
| Hypothetical behaviorome instance | (Note: the following examples are fabricated and presented for sake of clarification only)
· Commuting to work protects from cognitive decline but increases asthma exacerbations · Going frequently to restaurants of type X is associated to overexpressed microRNA-484 which is implicated in breast cancer risk[5] · Neighbourhoods close to healthcare facilities of type Y are associated with reduced incidence of Type 2 Diabetes · More frequent social interactions mitigate CVD risk[6] · Working outdoor is associated to microRNA changes that protect from COPD[7] |
Table 1. Human activity recognition in epidemiology: comparison of a state-of-the art approach with the innovative behaviorome application instance
During the year 2019, MultiMed Engineers further investigated the above ideas, to devise how the data collection part of the endeavor can be addressed by leveraging the concept of Digital Phenotype from Onnela et al.[8]
MultiMed Engineers reviewed the scientific literature regarding the design of platforms for measuring digital phenotypes, with the objective of broadening the types of “patient generated” personal data that can be harnessed to build behavirome-based solutions. This work conducted to the identification of several abstraction levels in personal data collection, i.e. from raw data to aggregate features at lower semantic levels (e.g. signal entropy, variance, etc.), to higher level features linked to user conduct (e.g. walking, sleeping, commuting to work, etc.). The work resulted in the selection and annotation of 20 papers from the scientific literature and the analysis of 19 digital phenotyping platforms.
On this basis, MultiMed Engineers compiled a first, tentative ontology for digital phenotyping and behavioral features that can be collected through commonly deployed IoT and smart devices, briefly sketched in the following list:
- Physiology
- Heart related
- HR
- HRV
- Blood pressure
- SpO2
- Heart related
- Behaviour
- Mobility
- Walking (time, distance, speed)
- Climbing stairs
- Still time
- Physical activity
- Calories burned
- Sleep quality
- ADLs
- Stand up
- Eating / drinking
- Toilet hygiene
- Bathing / showering
- Grooming
- Dressing
- Going out
- IADLs
- Communication
- Direct speech communication
- Phone usage (#incoming, #outgoing, #missed)
- Shopping
- Food preparation
- Housekeeping
- Laundry
- Transportation
- Medication management
- Finance management
- Communication
- Socialization
- Phone usage
- Attending social PoIs
- Cognition activity
- Watching TV
- Reading newspapers / books
- Attending cultural PoIs
- Cognitive traits
- Memory
- Attention
- Abstraction
- Viso-spatial perception
- Affective traits
- Stress
- Mood (depression / anxiety)
- Sentiment (positive, neutral, negative)
- Emotions
- Mobility
As part of the effort, MultiMed Engineers also developed exploratory prototypes, aimed at more precisely assessing the technological challenges that lie ahead in the quest for “digital phenotyping-based” behaviorome measurement.
For example, Figure 5 illustrates a prototype aimed at investigating how Android technology can be manipulated in order to obtain satisfactory behavior sampling, without unreasonable impact on apps’ footprint (memory usage, network bandwidth usage and battery drain).
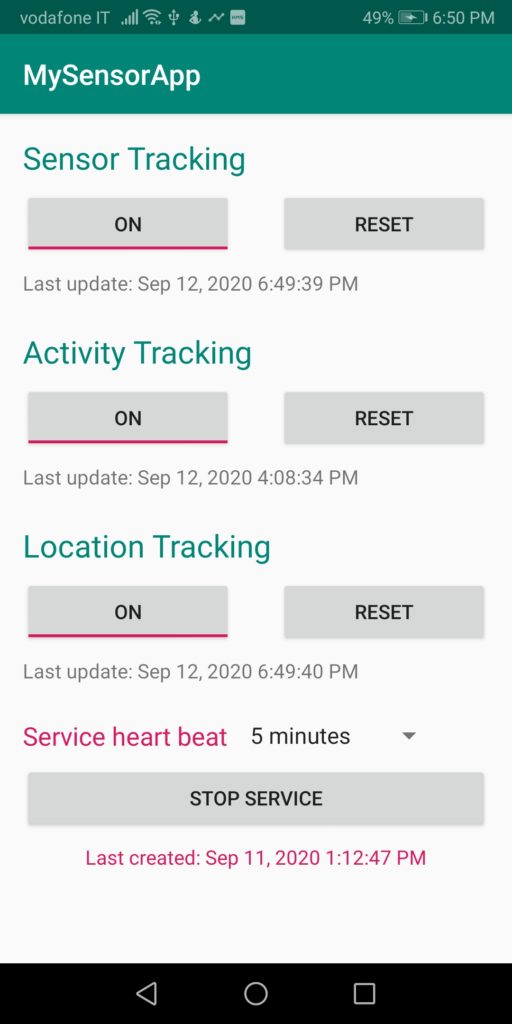
Figure 5. Exploratory prototype for collecting digital phenotype data on Android systems
The prototype collects (with user consent) GPS tracking data, activity transitions, and sensor data, with a period of several minutes. The prototype’s objective is to research how data collection can be implemented while minimizing memory, network and battery usage. Data had to be both (1) collected through Android sensors and APIs, and (2) transmitted to a central cloud repository as soon as possible, in order not to use up memory in the edge device (Google Firebase has been used for this task). The prototype also complies with relevant resource consumption limitations imposed by the Android platform by running as a foreground service, visible to the user.
The prototype developed by MultiMed Engineers achieved a 5 minute sampling rate at virtually negligible footprint, as illustrated in Figure 7 and Figure 8 below. In particular, Figure 7 shows that, although there is a need to periodically awake the system, the prototype is still able to significantly minimize the usage of the GPS radio (virtually imperceptible, in the Figure), resulting in a very low battery drain. Data are uploaded to the cloud only when a WiFi connection is available, thus minimizing network bandwidth usage.
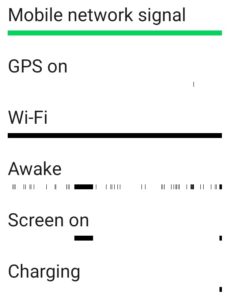
Figure 7. Awake state and GPS usage of the exploratory prototype
Figure 8 shows that the cloud storage requirements are also modest (the Figure refers to resource usage on a Firebase Realtime Database instance for 1 month, with a 5 minutes sampling period).

Figure 8. Cloud storage requirements of the exploratory prototype, Firebase Realtime Database instance, 1 month of usage with 5 minutes sampling period
References
[1] Chowdhury et al. Reducing NCDs globally: the under-recognised role of environmental risk factors, The Lancet, 2018
[2] Braveman et al. The Social Determinants of Health: It’s Time to Consider the Causes of the Causes, Public Health Rep. 2014
[3] Cook et al. Smart environments: Technology, protocols and applications. Vol. 43. John Wiley & Sons, 2004
[4] De Nazelle et al. Improving estimates of air pollution exposure through ubiquitous sensing technologies, Environ Pollut. 2013
[5] For implication of microRNA-484 in breast cancer risk see Zearo et a. MicroRNA-484 is more highly expressed in serum of early breast cancer patients compared to healthy volunteers, BMC Cancer, 2014
[6] This example is not fully fabricated; see e.g. Strike et al. Psychosocial factors in the development of coronary artery disease. Prog Cardiovasc Dis 2004
[7] This example is not fully fabricated, as microRNA profile changes have been shown to be associated with meteorological exposures: https://cordis.europa.eu/project/rcn/105690/reporting/en
[8] Onnela et al. Harnessing Smartphone-Based Digital Phenotyping to Enhance Behavioral and Mental Health, Neuropsychopharmacology, 2016
 MultiMed Engineers